Offline and Private Power BI Alternatives for Small Teams
Power BI is a strong product. It is also more than many small teams need, and its sharing model assumes your data goes to Microsoft's cloud. If you are an accountant handling client ledgers, a consultant under an NDA, or an EU business that would rather not add another place where personal data lives, that assumption matters.
This article compares practical alternatives that keep data on your own PC or your own server. It is written by the team behind one of them, so we have tried to be fair: each option gets its real strengths and its real catches.
What "offline" and "private" actually mean
Vendors use these words loosely. Before comparing tools, it helps to separate three questions:
- Where is the data processed? On your PC, on a server you control, or on the vendor's cloud?
- What leaves the machine? Telemetry, license checks, AI prompts, or the data itself?
- How do you share results? Sharing is where most "desktop" tools quietly move data to a cloud service.
For a small team, the useful target is: data processed locally, nothing but a license check leaving the machine, and sharing by files (PDF, PowerPoint, a workbook) rather than a hosted portal.
The options
1. Excel with Power Query and PivotCharts
You probably own it already. Power Query cleans and combines data, pivot tables summarize it, and PivotCharts plus slicers make a workable dashboard. Everything runs locally.
Strengths: no new software, everyone can open the file, Power Query steps refresh. Catches: dashboards take real effort to build and look like spreadsheets, large files get slow, and there is no plain-English question box or automatic chart picking. Branded, paginated reports mean a lot of manual layout.
2. Power BI Desktop (without the service)
Power BI Desktop is free and runs on your Windows PC. You can load local files, model them and build reports without uploading anything.
Strengths: very capable modelling and visuals, free to install, huge community. Catches: sharing a live report with colleagues normally means publishing to the Power BI service, which is cloud-based and needs paid licences for publishers and viewers in most setups. Without the service you are left sending .pbix files (recipients need Power BI Desktop) or exporting to PDF. DAX and data modelling take time to learn.
3. Tableau Desktop
Tableau Desktop runs locally and is excellent for visual exploration. It is sold as part of Tableau's per-user subscriptions, and sharing is built around Tableau Cloud or a Tableau Server you host.
Strengths: great visual analysis, mature product. Catches: price per user is high for a small team, and private sharing means running your own server. Avoid Tableau Public for anything sensitive; it publishes your workbook to the open web.
4. KNIME Analytics Platform
KNIME is a free, open-source desktop tool that builds data workflows by connecting nodes. It runs locally and is very powerful for data preparation and analysis.
Strengths: free, local, handles complex pipelines. Catches: it is a workflow tool first, not a dashboard tool; business users find it technical, and polished, branded reports are not its focus.
5. Self-hosted Metabase or Apache Superset
Both are open-source, browser-based BI tools you install on your own server. Data stays inside your infrastructure and colleagues view dashboards in a browser.
Strengths: free software, real web dashboards, good for teams with a database. Catches: someone has to install, secure, update and back up a server. They work best on top of a SQL database, so messy Excel files need cleaning elsewhere first.
6. QikAnalytix
QikAnalytix is the Windows desktop app we build for people who live in Excel and don't want to learn a BI tool. You load an Excel or CSV file (or connect SQL Server, PostgreSQL, ODBC, Google Sheets, SharePoint, a PDF table or an API), and a dashboard with KPI cards and recommended charts appears straight away.
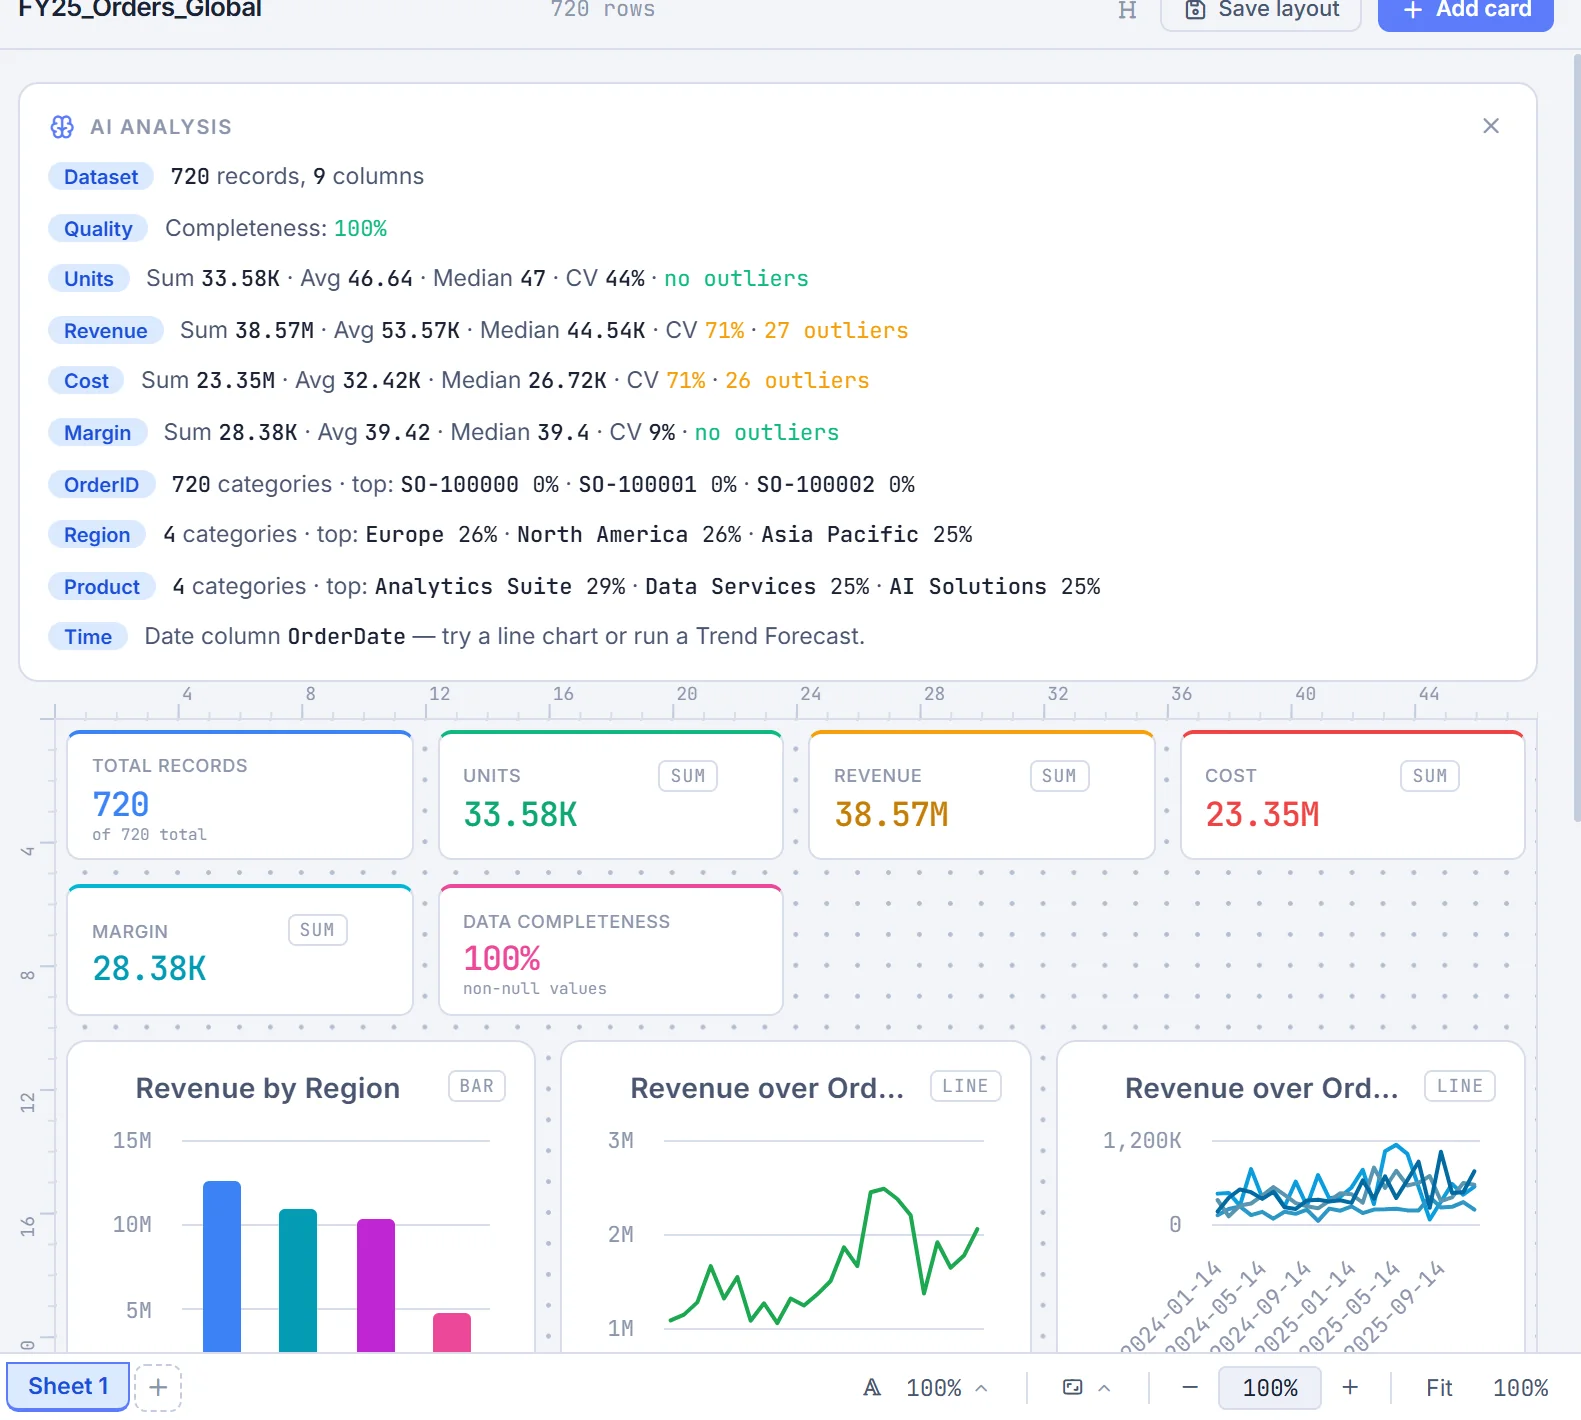
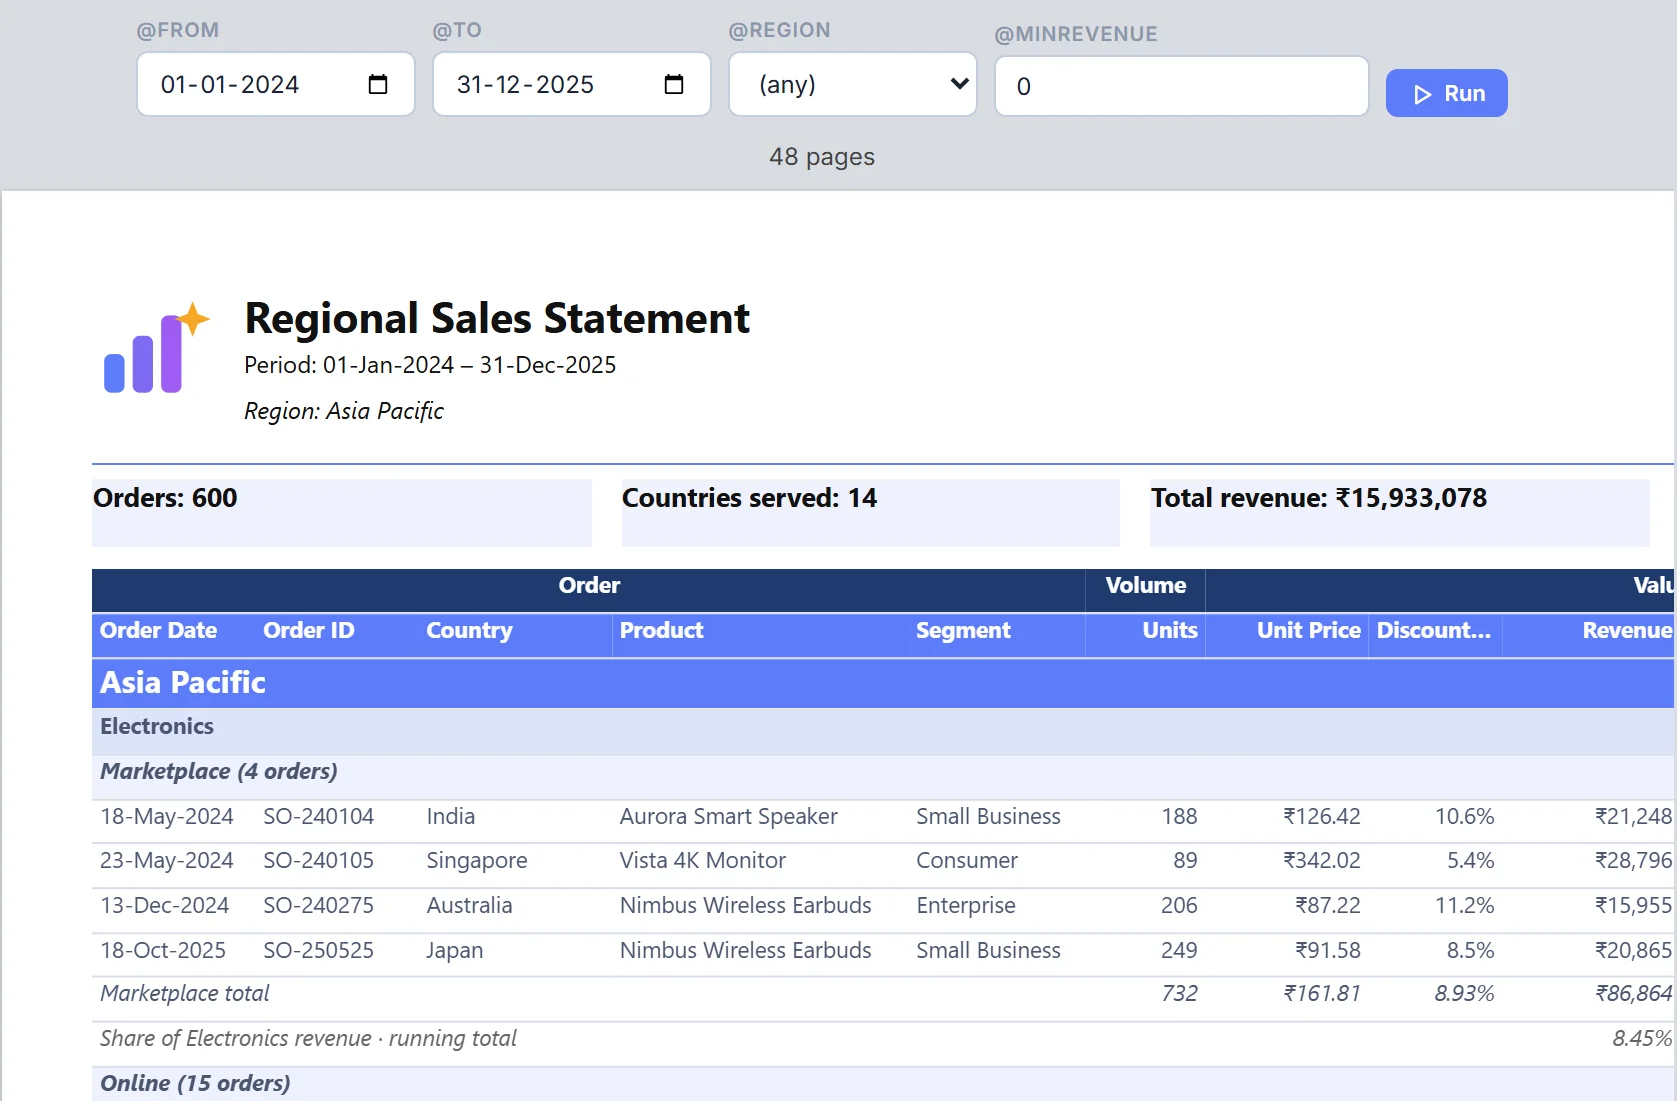
Cleaning is one scan with a preview of every fix. Fuzzy matching, pivots, joins, a visual data model, trend forecasts and what-if scenarios are point-and-click. VizBOT, the built-in assistant, answers plain-English questions and builds charts; it runs on your PC with no API key, and every number is computed from your rows by the app. A Report Builder makes paginated reports with groups and subtotals, and Brand Kits put your colors, font and logo on every chart and PDF page.
What leaves the machine: a license check (your key, a hashed machine fingerprint and the app version) and an update check. Online sources are fetched only when you connect them. An optional Anthropic API key mode sends your question and column names, never rows, and only if you add a key.
Strengths: no code, everything from cleaning to a branded PDF in one app, works fully offline after activation, $5.99 per user per month billed annually. Catches: Windows only (no Mac or Linux), no hosted web portal, and no timed background refresh. Colleagues need the app to open a .qap workbook; everyone else gets a PDF, PowerPoint, image, CSV or Excel export. It is also a young product from a small team.
Side-by-side comparison
| Tool | Where data is processed | Private sharing | Skills needed | Cost for a small team |
|---|---|---|---|---|
| Excel + Power Query | Your PC | Send the file | Moderate (Power Query, pivots) | Already owned by most |
| Power BI Desktop | Your PC | .pbix file or PDF; live sharing needs the cloud service | Moderate to high (modelling, DAX) | Free desktop; paid per-user licences to share online |
| Tableau Desktop | Your PC | Self-hosted Tableau Server or packaged files | Moderate | Per-user subscription, high for small teams |
| KNIME | Your PC | Export results; sharing workflows | High (workflow building) | Free desktop |
| Metabase / Superset (self-hosted) | Your server | Browser dashboards on your network | IT to run the server; SQL helps | Free software plus server time |
| QikAnalytix | Your PC | PDF, PowerPoint, Excel, or .qap workbook | Low (menus, drag-and-drop, plain English) | $5.99 per user per month, billed annually |
Prices and licensing change; check each vendor's current pricing page before you decide.
How to choose
- You need live web dashboards for 30+ viewers and have IT support: self-hosted Metabase or Superset, or Power BI with the service if the cloud is acceptable.
- You have an analyst who wants deep modelling and is happy to learn: Power BI Desktop or KNIME.
- Your team lives in Excel, data must stay on the PC, and the output is a monthly pack or a client deliverable: Excel with Power Query if you have the time, or a desktop app like QikAnalytix if you want cleaning, dashboards and branded reports without building them by hand.
- You are on a Mac: rule out Power BI Desktop and QikAnalytix; look at Excel for Mac, Tableau Desktop or a self-hosted web tool.
A note for EU teams and GDPR
No software makes you GDPR compliant by itself, and this is not legal advice. What a local tool changes is the number of places personal data goes. If customer names, salaries or patient details never leave the analyst's PC, there is no new cloud processor to assess, no new data transfer to document, and less to explain in a security questionnaire. That is often the difference between "we can start this week" and "we need sign-off first".
Whatever you pick, ask each vendor three questions in writing: what is sent from the machine, when, and where it is stored.
FAQ
Can Power BI work completely offline?
Power BI Desktop runs on your PC and can build reports from local files without uploading them. Sharing reports with colleagues through the Power BI service means publishing to Microsoft's cloud and, in most setups, paid per-user licences.
Is a local BI tool automatically GDPR compliant?
No tool makes you compliant on its own. Keeping personal data on your own machines does reduce the number of places it is processed and the vendors you need to assess, which usually makes the review simpler. Check with your data protection lead.
What is the cheapest way for a small team to get dashboards without the cloud?
If you already own Excel, start with Power Query and PivotCharts. If you need dashboards, cleaning and branded reports in one place without learning a BI tool, a desktop app such as QikAnalytix costs $5.99 per user per month, billed annually.
Want to see your own file on a dashboard today, without uploading it anywhere? Download the free 7-day QikAnalytix trial. Windows 10 and 11, no admin rights, no credit card.